
Image source: Google Gemini. Gemini won’t draw people, i.e. sketchy looking men in business suits, so I asked it to draw “a robot similar to Bender from Futurama”, and that did the trick. Worried about copyright? Suggest you talk to Google.
TL&DR summary: a recent paper published by Dutch researchers in the journal Nature Energy (K. de Kleijne et al, May 28 2024, https://doi.org/10.1038/s41560-024-01563-1, evaluated lifecycle emissions from around 1000 projects in the IEA Hydrogen Projects Database. Making best efforts to estimate the real GHG emissions associated with renewable electricity generation, battery storage (if required to obtain high enough capacity factors), electrolyzer manufacture and (negligible) water treatment, the median green hydrogen project of the optimal configuration (“islanded”, but with excess renewable electricity being fed to the grid) of 2.9 kg CO2e/kg H2 (range of 0.9 to 4.6 kg CO2e/kg H2). Adding 1000 km of pipeline transport- the cleanest option- added another 1.5 to 1.8 kg CO2e/kg H2. Whether or not that should be considered adequately “clean” hydrogen, depends greatly on the use case for that hydrogen- a topic the authors of the Nature paper simply did not consider.
A recent paper in Nature Energy (reference above) made a valuable attempt to answer the question: how green is green hydrogen, really?
Most green hydrogen project assessment tools assume that the GHG emissions associated with renewable electricity generation are zero. And that, clearly, is a bad assumption. All electricity generation processes including wind and solar, have GHG emissions associated with both the production of the initial generation equipment, and with ongoing maintenance.
The authors looked at over 1000 projects in the IEA Hydrogen Projects Database. Most of these were green hydrogen projects, meaning projects putatively using renewable energy (wind, solar or hydro generally) to make hydrogen from water via electrolysis. Projects using nuclear electricity as well as projects making hydrogen from methane, i.e. the good old-fashioned, high emission way which really should be called “black hydrogen” but which the industry euphemises as “gray”, with and without carbon capture and storage (CCS), are also used for reference. Methane emissions varying from 0.5% to 8% for the natural gas source are considered, but the likely comparator basis is the 100 year time horizon for methane (i.e. global warming potential for methane of 33x that of CO2).
The authors grouped green hydrogen projects into four basic production scenarios:

- Off grid (i.e. “islanded”) production, with new (additive) wind and/or solar built out at 2x the electrolyzer’s capacity, with a Li ion battery storing about 25% of the electricity where necessary to achieve an electrolyzer capacity factor of between 0.4 and 0.6. These projects had median emissions of between a little over 1 kg CO2e/kg H2 for offshore wind, to about 7.5 kg CO2e/kg H2 for a pure solar project. In each case, the majority of emissions was from electricity production, with excess electricity being curtailed. In each case the emissions associated with battery and electrolyzer production were small, on the order of ~0.5 kg CO2e/kg H2 at most. The rest was electricity related emissions. And with hydrogen taking on the order of 50 kWh per kg to produce via electrolysis, you can see that even very small emissions from electricity, add up rapidly per kg of H2.
- Grid connected with power export: this assumes that the local grid absorbs excess renewable electricity when it is beyond the electrolyzer’s capacity to use it, exporting it to the grid where it decreases local grid CO2e intensity by the difference between the average grid CO2e intensity in that country or region, and the intensity of wind/solar per kWh in that region. This of course assumes that other, non hydrogen-related grid connected renewables projects haven’t already saturated the grid’s ability to absorb and use their peak production. The credit for the exported electricity reduces CO2e intensity to about 0.8 for offshore wind to a little over 4 kg CO2e/kg H2 for solar
- Grid connected, with grid power import: this one is a real stinker, with GHG emissions associated with imported grid electricity totally swamping the benefit of renewable energy use. Emissions here ranged from over 6 to over 16 kg CO2e/kg H2. Note that this is despite the renewable electricity being used, being “additive” (new to the grid). This is the shell-game that most green hydrogen projects in the US and Canada are trying to pull off, using “power purchase agreements” with other renewables suppliers to make up their own local shortfall in production, despite the fact that the power will be delivered to them via the grid- and that the grid has a certain carbon intensity. It seems, to me at least, that the all important factor of “temporal matching” between renewables generation and electrolyzer operation, never had a better piece of evidence in favour of it than this work!
- Configuration-independent applications, including using nuclear electricity (results are low GHG green hydrogen below 2 kg CO2e/kg, but utterly unaffordable in any electricity market on earth. Another considered was an electrolyzer running at 5% capacity factor (again, utterly unaffordable), but using only renewable electricity that would otherwise be curtailed which is then given an intensity of 0 kg CO2e/kWh. The result is very clean but very unaffordable hydrogen. Hydroelectric hydrogen has a CO2e of just over 2 kg CO2e/kg, while grid electricity used to run electrolyzers has an eye-watering intensity of over 21 kg CO2e/kg, making even black (gray) hydrogen without CCS look favourable in comparison
The work is interesting, and carefully done, with good references. It’s a shame they didn’t give ranges for the CO2e/kWh for wind and solar that they used, but they gave formulae from a reference LCA paper which relates these figures to wind speeds and solar irradiances, which vary greatly by location including for a variety of types of PV panels etc.
All of this of course gets worse when you add hydrogen distribution. Pipeline distribution is most efficient, with CO2e additions of about 1.2 to 1.5 kg CO2e/kg H2 for a pipeline of 1000 km. Liquid hydrogen and ammonia, even without ammonia cracking back to hydrogen at destination, are much worse than that due to largely energy losses in interconversion and transport.
Major Conclusions
It appears that although many of the projects, even on a proper full LCA basis per the authors’ work, even assuming uses for the product hydrogen immediately on-site, give CO2e/kg figures sufficient to meet the minimum requirements for subsidy under US IRA, EU and UK rules, most projects don’t make what the Hydrogen Science Coalition would consider to be “clean” hydrogen of 1 kg CO2e/kg H2. The HSC clean hydrogen standard is based on the CO2e intensity for hydrogen production required for the world to meet the stated 2050 emission reduction goals (i.e. “net zero” by 2050).
The reason for the high carbon intensities isn’t that green hydrogen projects are burdened with heavy embodied emissions for either the electrolyzers or for batteries (the use of which is questionable in this study). Both add a little- but the big killer is electricity production and its associated emissions.
Grid electricity to raise capacity factors is obviously a bad deal. While economically imperative (because electrolyzers are too expensive to operate at low capacity factors), grid electricity simply blows out the resulting hydrogen’s CO2e intensity to an absurd degree on most grids in the world.
While export of excess green energy to the grid has been shown in this work to reduce the effective CO2e of the product hydrogen, the ability of the local grid to usefully absorb this electricity- which would be made in excess by any grid connected project without an electrolyzer during the exact same periods of time- is just taken as a given. This will not be true in most places, especially as renewables are rolled out to a greater and greater extent.
Another surprising result is that local hydrogen production is nearly always lower in GHG emission than green hydrogen made in locations with better access to wind and solar- if those locations require hydrogen transport by anything other than pipeline, or even by pipeline of longer than about 1000 km.
What the Authors Missed
In the paper, use cases for the product hydrogen are absolutely ignored. The preamble talks about the necessity of and plans for green hydrogen to expand in production and to become a trade commodity etc.- the usual #hopium laced hydrogen economy hyperbole. What is not discussed is the CO2e per kWh of useful energy services delivered to destination, relative to other options.
When green hydrogen is following my Drake meme, and being used to replace existing uses of black (gray) hydrogen which require hydrogen’s unique chemical properties and which are durable post decarbonization, it can be said that such green hydrogen is “no regret”.

The only appropriate metric for such hydrogen is against the hydrogen it replaces- black (gray) hydrogen, made for instance from natural gas with methane leakage accounted for. Such hydrogen ranges from 12 to 18 kg CO2e/kg H2, depending on methane leakage rates and whether you use the 20 or 100 yr GWP of methane relative to CO2. Even reducing the 14 kg CO2e/kg hydrogen generated, optimistically, from natural gas in Alberta, for instance, to about 12 kg CO2e, as the blue (bruise coloured) Shell Quest project does by doing partial CCS, is arguably OK- though the cost per tonne of CO2e emissions averted is ridiculously high-if the hydrogen is used for things like ammonia or methanol production, direct iron reduction, food oil hydrogenation etc. etc.- things that we’ll still need to do post decarbonization. Not so for Quest- it’s used to desulphurize and hydrocrack fossil tarsands bitumen, which we will simply stop doing post decarbonization, preferring to make chemicals and materials out of lighter, sweeter crudes better suited for the task.
But when green hydrogen is to be wasted as a fuel, whether for transport or heating, the appropriate metric is what we could do instead to deliver those energy services.
For transport, the appropriate metric isn’t against fossil fuel use, but against the use of the same electricity to charge battery EVs. And we all know, or should know, that on that basis, BEVs are simply going to blow hydrogen to smithereens in terms of kg CO2e/100 km driven. But since you a) are smart, and don’t believe what people tell you just because they sound credible and have a bunch of unkempt gray hair (i.e. people like me!), you want some numbers: so here are some numbers.
Going back to my paper comparing the Toyota Mirai Mk 1 against the Tesla Model 3 long range version,
https://www.linkedin.com/pulse/mirai-fcev-vs-model-3-bev-paul-martin
EPA range for the Tesla was 334 miles and for the Mirai was 312 miles. To go 312 miles, the Mirai uses about 5 kg of H2. Assuming the median H2 emissions from this study of 2.9 kg CO2e/kg H2, that’s about 2.83 kg CO2e/100 km if green hydrogen were used, ignoring distribution losses for the moment for both the H2 and electric car. The Tesla, on the other hand, uses 260 Wh/mile or 86.8 kWh (from the wall, including charger and battery polarization/ohmic losses- 75 kWh from the battery pack). That’s about 15.9 kWh/100 km. To equal the GHG emissions of the Mirai, the local grid intensity would need to be 2.83 kg CO2e/15.9 kWh, or 178 g CO2e/kWh. There’s no way renewable electricity has anything close to that high a carbon intensity- local GRID CO2e here in Ontario is about 40 g CO2e/kWh. So unless you are comparing a GRID recharged EV to median renewable only green hydrogen production, you can see clearly that the BEV is the clear winner. Its greater energy efficiency necessarily reduces GHG emissions from operation of the vehicle, and it is also clear that operational emissions over a norma vehicle’s live, positively dwarf the embodied emissions from making the vehicle- even one with a large 75 kWh battery pack. (note: fuelcells and 700 bar composite hydrogen tanks are not low in embodied emissions, either)
Looking this time at heat: 1 kg of H2 with a CO2e of 2.9 kg, has a higher heating value of 39.4 kWh. Feed that to a 95% AFUE boiler or furnace and you’d get about 37.4 kWh of heat into a home, again ignoring hydrogen distribution losses and emissions. We could instead feed 12.5 kWh of electricity to a heatpump with a coefficient of performance of 3, to do the same job. 2.9 kg CO2e/12.5 kWh would be even higher- 232 g CO2e/kWh- way too high to be of renewable origin.
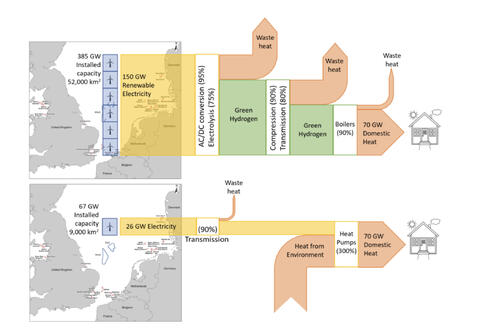
Electric heat pump vs hydrogen boiler heating for the UK, an energy chain comparison (source David Cebon, Hydrogen Science Coalition)
When we consider feeding the very same electricity to these end use cases that would have been sent to the green electrolyzer- you get the picture. There’s no comparison. Direct electrification wins, hands down. And no, the storage feature that hydrogen proponents want to hang their hats on, simply isn’t worth those extra use case emissions when hydrogen is wasted as a fuel or deployed as a long distance energy carrier, either directly or in the form of a so-called e-fuel.
Disclaimer: this article was written by a human, and humans are prone to making mistakes. Where I’ve made a mistake, please provide good references and correct me, and I will correct the text with gratitude. I care more about getting the issues right than about being right myself.
If however I’ve upset you by pissing on your pet idea, then please contact my employer, Spitfire Research Inc., who will be more than happy to tell you to piss off and write your own article.